System Layout by John Person & Jeffrey A. Scott, MD
Two playbooks. Two layouts. One platform.
Sweeter Trade is the market analysis platform with system layouts by
John Person and Jeffrey A. Scott, MD. Each founder built their own workspace
into the platform: JP Layout for multi-timeframe trade execution, and
JAS Layout for single-chart screening and analysis. This guide maps both
layouts to the same shared core features, so you can move between them without relearning anything.
ProductSweeter Trade™
LayoutsJP Layout · JAS Layout
Core features8 Core Sections
Version1.1.3 Spectrum
Interface Maps
Two layouts. Numbered for clarity.
Each numbered marker points to a feature — click to jump to its detail section below. The same numbers appear on both layouts so you always know where you are.
A · JP Layout
JP Layout
JP Layout — Multi-Timeframe Workspace
Screener on top · Three charts (M/W/D) below
B · JAS Layout
JAS Layout
JAS Layout — Single-Chart Workspace
Chart on left · Screener panel on right · Seasonality tab in ribbon
Feature Specification
One set of explanations. Both layouts covered.
Each card below explains a feature, how to use it, and gives tips that apply across both JP Layout and JAS Layout. Section 8 covers the Seasonality workspace inside JAS Layout.
The Layout Tabs let you switch between purpose-built analysis workspaces. In JP Layout they appear at the very top as JP Market Breadth and JP Layout. In JAS Layout the tab ribbon is broader — JAS Layout, Timing Brief, Guppy Charts, US Index ETFs, Commodities ETFs, Daily Brief, Buckets Brief, Market Breadth, Ratio Charts, Seasonality, Financials and user-created layouts. Each tab preserves its own chart settings, indicators, and panel arrangement so you can flip between macro views and trade execution without rebuilding anything.
How to Use
Click any tab name to switch to that layout quickly.
Click the ☰ hamburger menu, then choose New Layout to create a new custom user layout, or Manage Layouts to duplicate, reorder, or hide/unhide layouts.
Your 1st layout is restored automatically on next launch.
💡 Tips & Notes
Start your session in a breadth layout (JP Market Breadth or Timing Brief) for a macro pulse, then drill into the primary JP Layout or JAS Layout for individual setups.
Note: Modifying indicators inside one layout does not affect others — each layout is sandboxed.
The Chart Settings cluster controls how price is rendered on the chart. From left to right, the controls let you switch the chart type (line, OHLC bar, candlestick, etc.), set the bar count (number of bars displayed — 255 by default), and choose a lookback range with quick options like YTD or 1Y. The » icon jumps the chart to the most recent bar. In JP Layout these controls apply across all three timeframe charts simultaneously; in JAS Layout they affect the single chart pane.
How to Use
Click a chart-type icon to switch rendering style (line, OHLC bar, candlestick, etc.).
Use the bar-count input to set how many bars display on screen (e.g., 255).
Click YTD to show year-to-date data, or 1Y to show data back one year.
Click the » icon to jump to the end of the chart — the last bar is the latest data.
💡 Tips & Notes
Use the News pin during earnings season to keep headlines visible while watching price action react in real time.
Set the timeframe context (Daily, Weekly, Monthly) and use the Jump to Date picker to navigate to a specific custom date. On a single chart, these controls drive that one chart. When multiple charts are open, they anchor the time axis across all synchronized charts simultaneously — or, if sync is unselected, they drive only the currently selected chart.
How to Use
Sync Charts — the Sync icon synchronizes the time axis across multiple charts. When only one chart is open, it has no effect.
Timeframe multiplier — the number box lets you change the timeframe multiplier (e.g., setting it to 2 with D selected displays a 2-day chart). Type a value and press Enter to apply.
Click D, W, or M to set the active timeframe context (Daily, Weekly, or Monthly).
Use the date picker to jump to a specific historical date.
Use the mi or H buttons for intraday timeframes (minutes, hours) when needed.
💡 Tips & Notes
For top-down analysis, start on Monthly, confirm on Weekly, time entries on Daily. JP Layout's three-chart view shows all three at once.
Add and configure technical indicators — moving averages, HighJump, JP-LCC, JP-Pivots, PMC, VH, RS, OBV, and more — and access the on-chart drawing toolset (trendlines, Fibonacci, channels, annotations). In both JP Layout and JAS Layout, indicators apply to the selected chart only.
How to Use
Selected Symbol — the symbol name (e.g., Circle Internet Group) is displayed in the toolbar. Click it to change the active symbol.
Click Indicators to open the indicator library.
Double-click an indicator in the library to add it to the chart. Expand its entry to change parameters.
Use the drawing icons in the left toolbar to annotate the chart (trendlines, Fibonacci, channels, text, and more).
Each chart pane lets you remove indicators, change parameters, or adjust colors directly from the pane itself.
💡 Tips & Notes
Drawing annotations are saved per symbol — they reappear when you return to the same ticker.
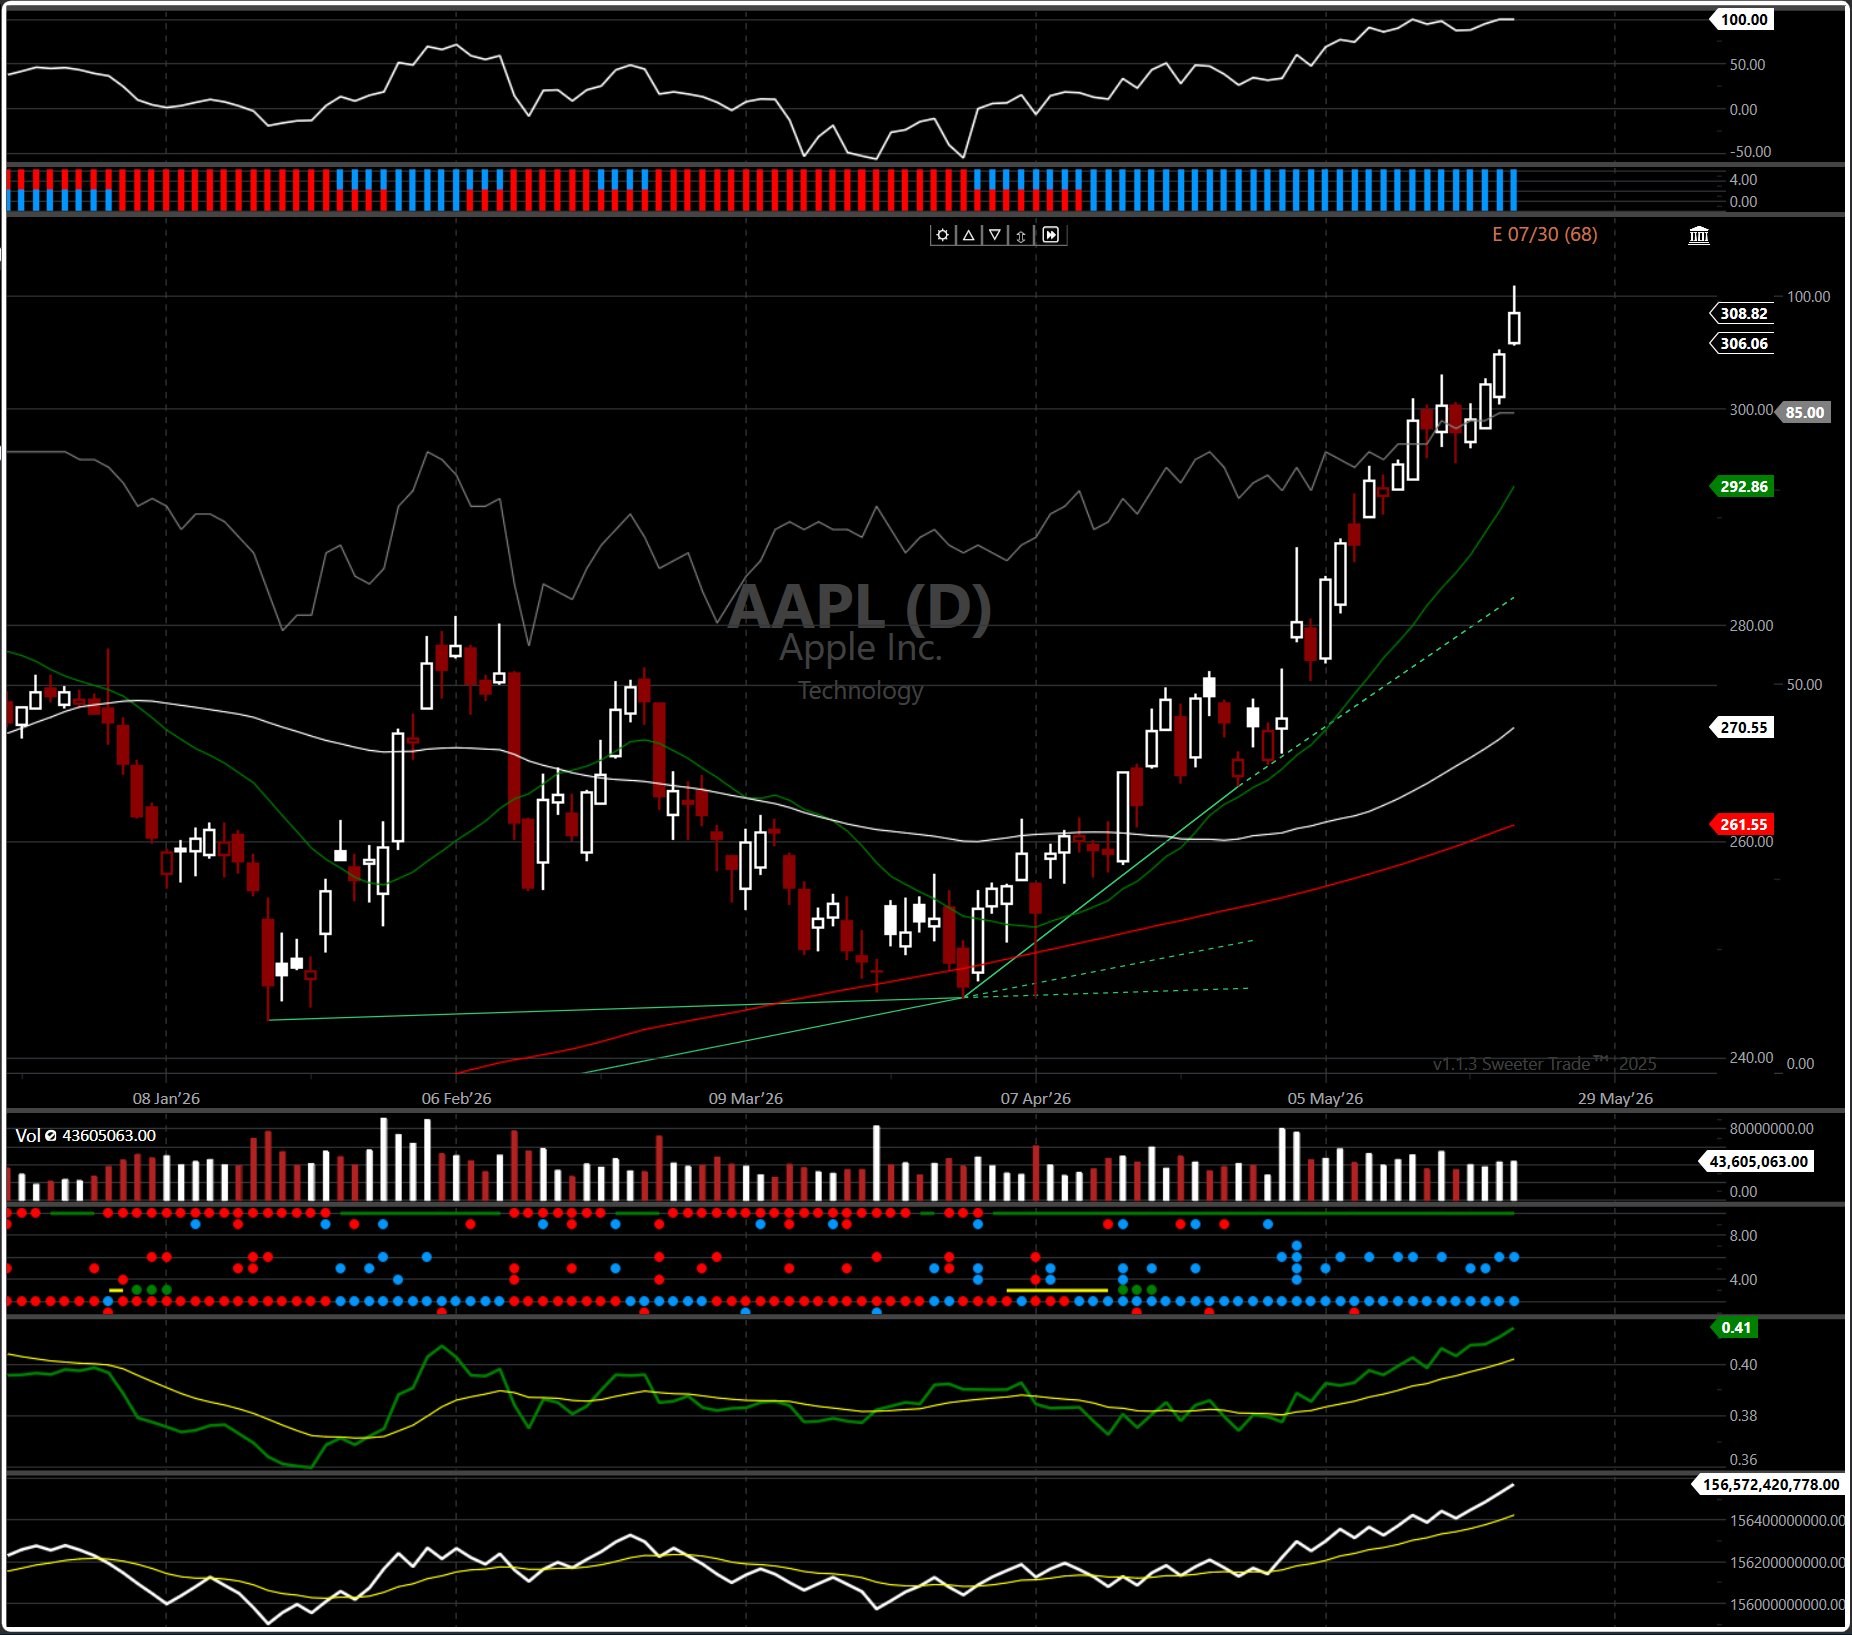
The Chart Area is the visual heart of both applications. JAS Layout stacks multiple analytical layers in one chart: the HighJump indicator at the top measures momentum strength; the main price chart displays candles with 17/50/200 moving averages; the volume pane includes confirmation dots; and the RS-SPY and OBV panels at the bottom track relative strength and accumulation. JP Layout takes a different approach — three synchronized charts display the same symbol across Monthly, Weekly, and Daily timeframes side by side, each with JP-LCC and JP-Pivot levels plus stacked PMC and VH indicator panels. Both layouts give a complete top-down read at a glance.
How to Use
Zoom the time axis — use the mouse wheel to zoom in or out, or scroll horizontally to pan.
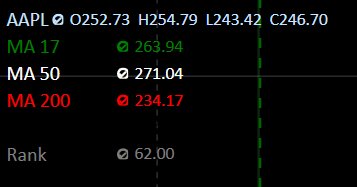
OHLC values — the top-left of each pane shows the symbol with its Open, High, Low, and Close values for the hovered bar, along with active indicators (e.g., MA 17, MA 50, MA 200, Rank).
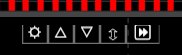
Pane toolbar — the top-middle of each pane has a small toolbar with ⚙︎ Settings (remove or change colors of indicators in that pane), ▲ / ▼ to reorder indicators, and ⇅ for additional pane controls.
Drag the pane dividers to resize panels vertically.
Multi-chart loading(JP Layout only) — click any screener row to load that symbol across all three charts at once.
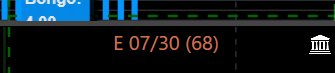
📅 Earnings Countdown
The top-right of the price chart shows the upcoming earnings date in the format E 07/30 (68) — the date and the days remaining until earnings.
🏛️ Congressional Transparency
A white Capitol building icon in the top-right indicates the symbol has Senate and Congress insider trades worth investigating.
Figure 5.1: High-Fidelity Chart Canvas and Sub-Study Layers
The Scanner Tabs row gives one-click access to curated user lists and screens — Hot List, Hot List A, Hot List B, Hot List C, My Positions, Longs, Shorts, JAS Buys, PD Buys, New List and any custom lists you create. Each tab loads its symbol list in the grid below, with an index filter strip above (JAS, Weeklies, RU1000, RU2000, SP1500, NYSE, NASDAQ, ETFs, SP500, NQ100, INDEXES) to scope the universe. Each tab is the entry point to a different angle of the top-down methodology.
How to Use
Click any tab to load that user list's symbols in the grid below.
Use the index filter strip above the tabs to scope the universe (e.g., SP500 only, NASDAQ only).
Click any row to load that symbol into the chart view.
💡 Tips & Notes
Begin every session with a strength scanner to identify the strongest themes before drilling into individual names.
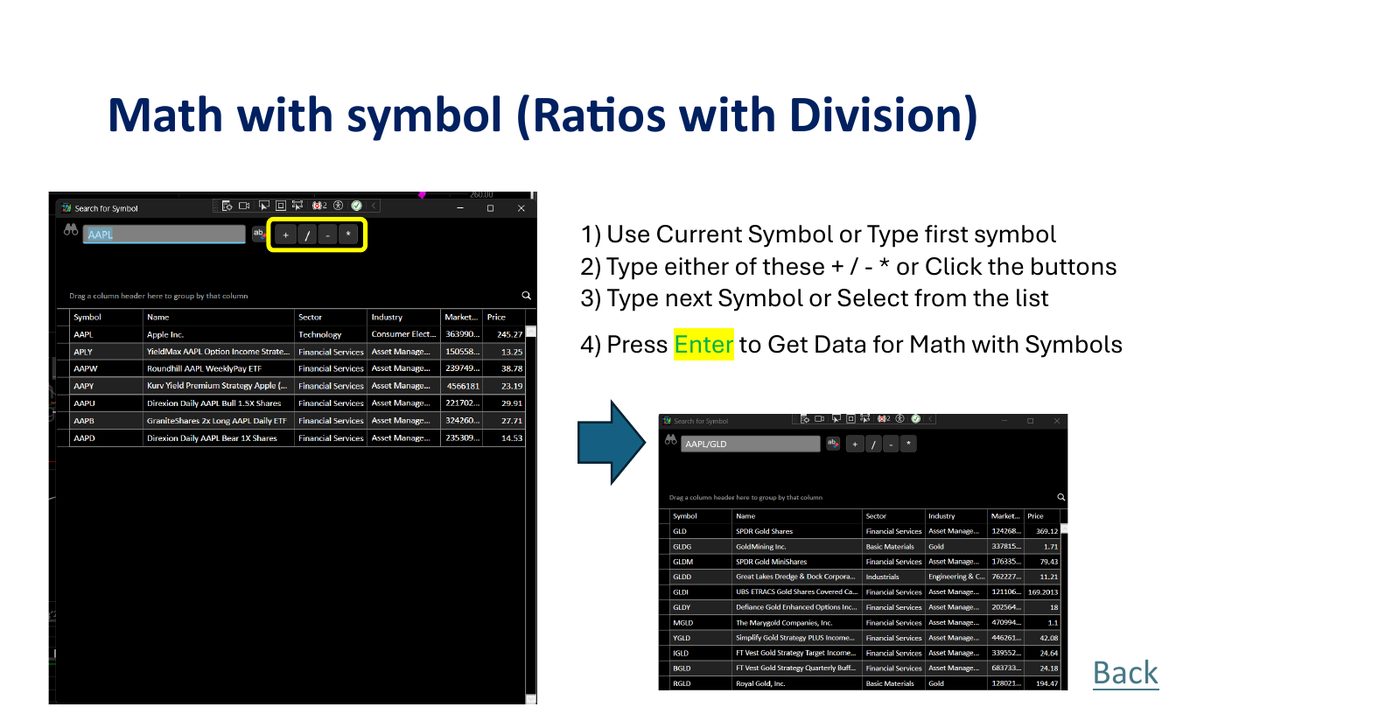
Use Math with Symbols to create custom ratios like AAPL/SPY for relative strength analysis, or GLD/SLV for sector relationships.
✨
Special Watchlist Tools Suite
The toolbar above the grid and right-click menus expose powerful list-management operations.
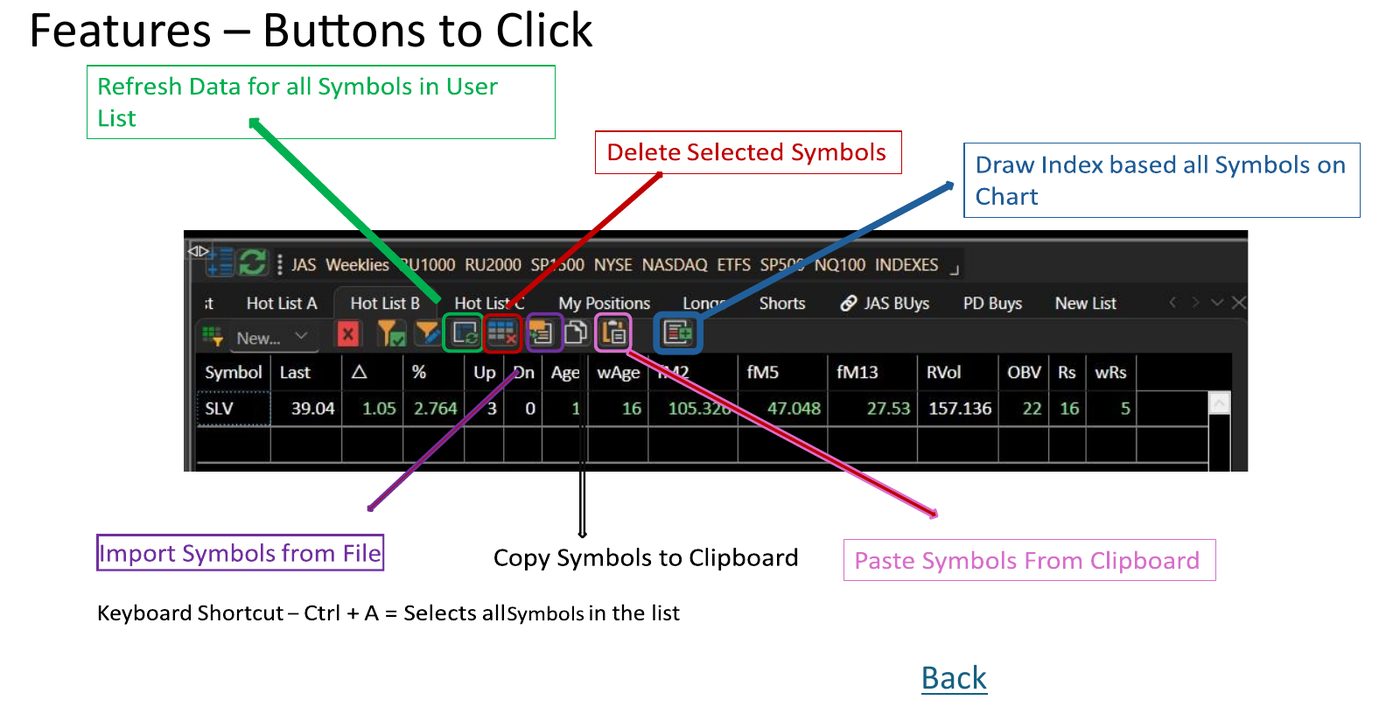
Watchlist Toolbar Command Bar
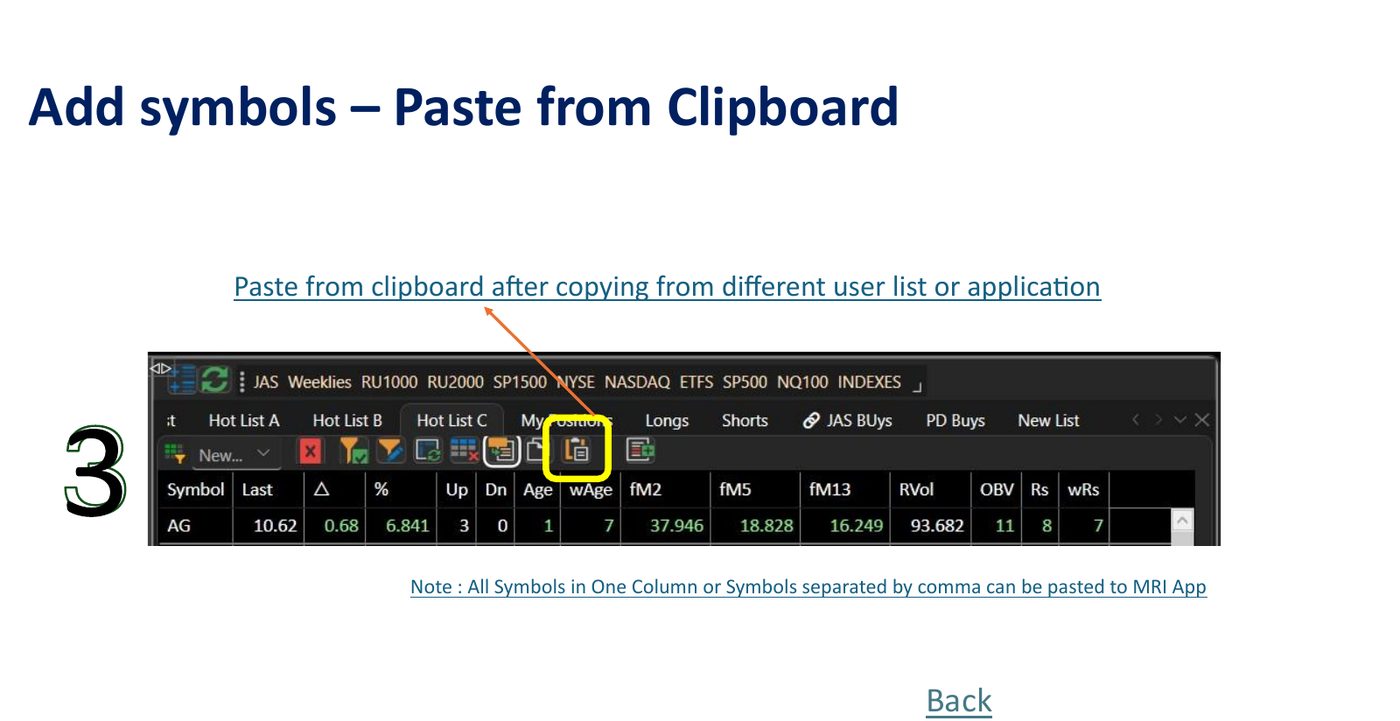
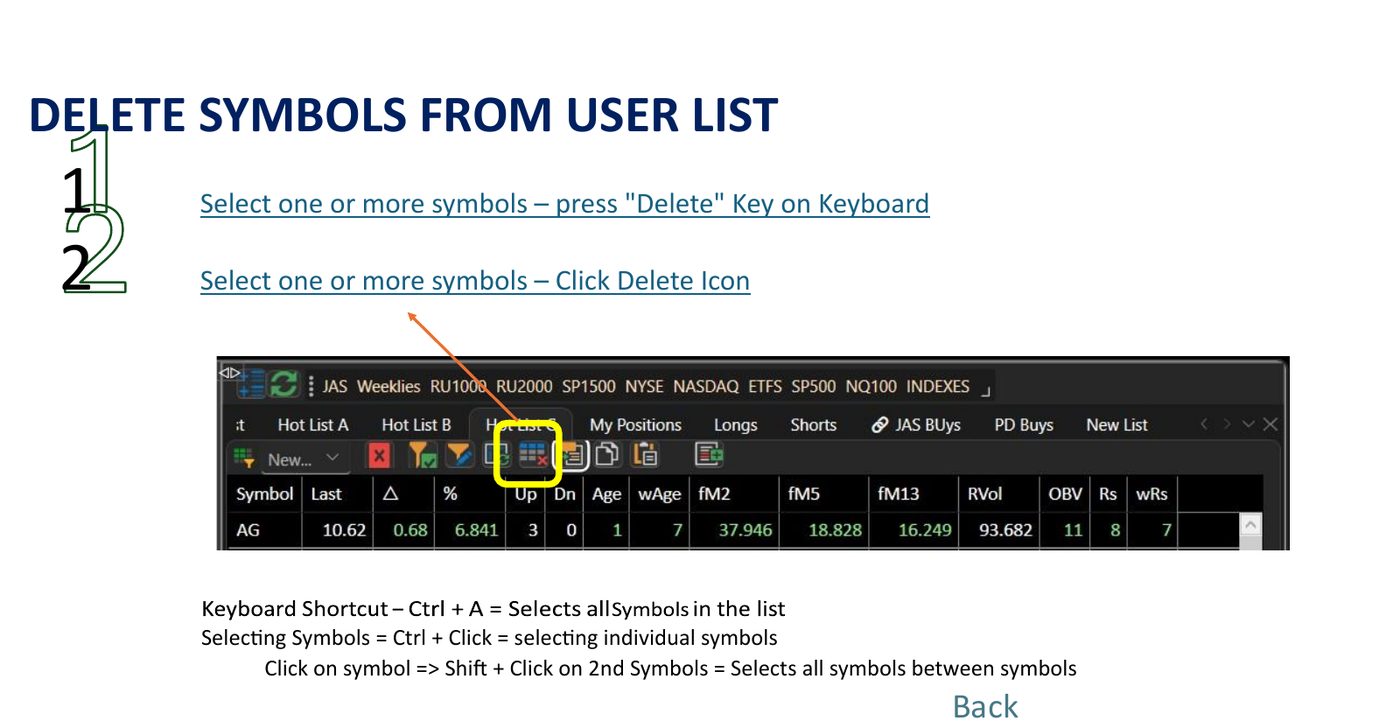
Action buttons above grid (left to right): Refresh Data, Delete Selected Symbols, Import Symbols from File (.txt/.csv), Copy Symbols to clipboard, Paste Symbols, and Draw Custom Index curve.
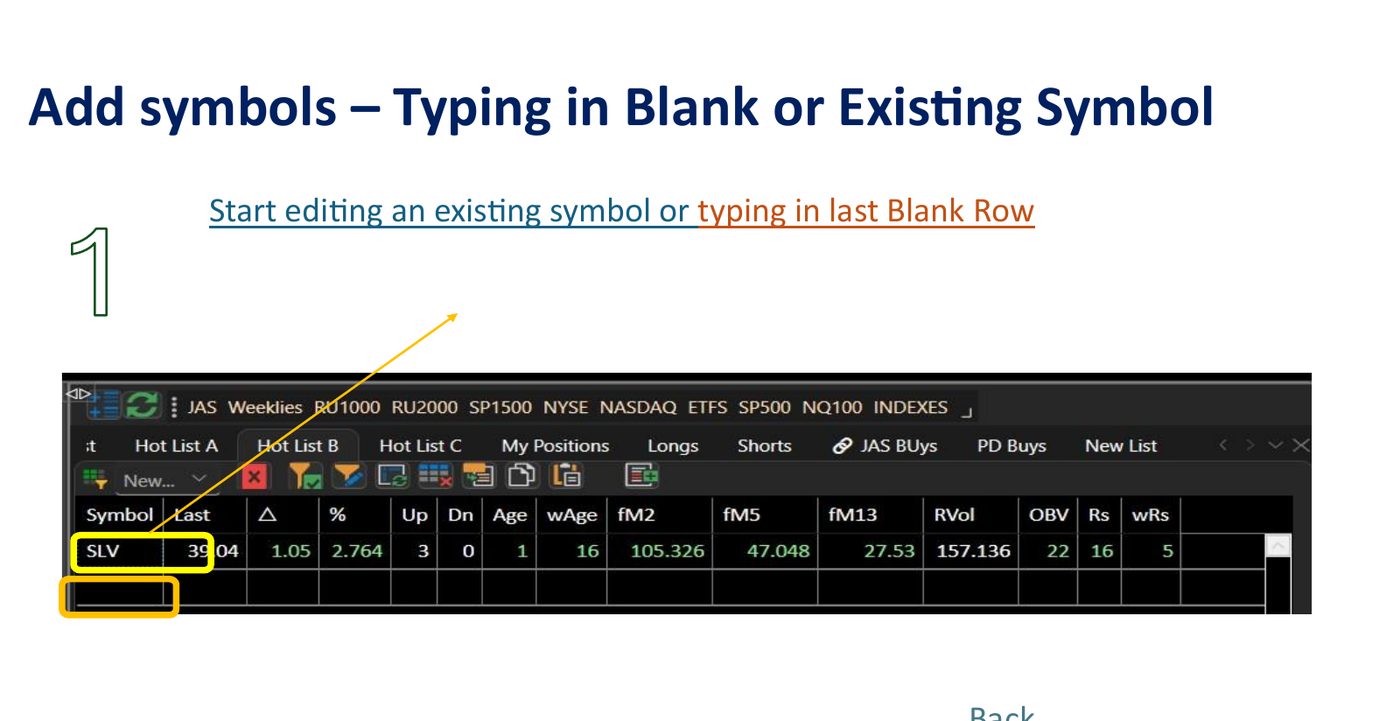
Add Symbols via Console
Start typing into the last blank row directly in the screener grid to add any ticker instantaneously.
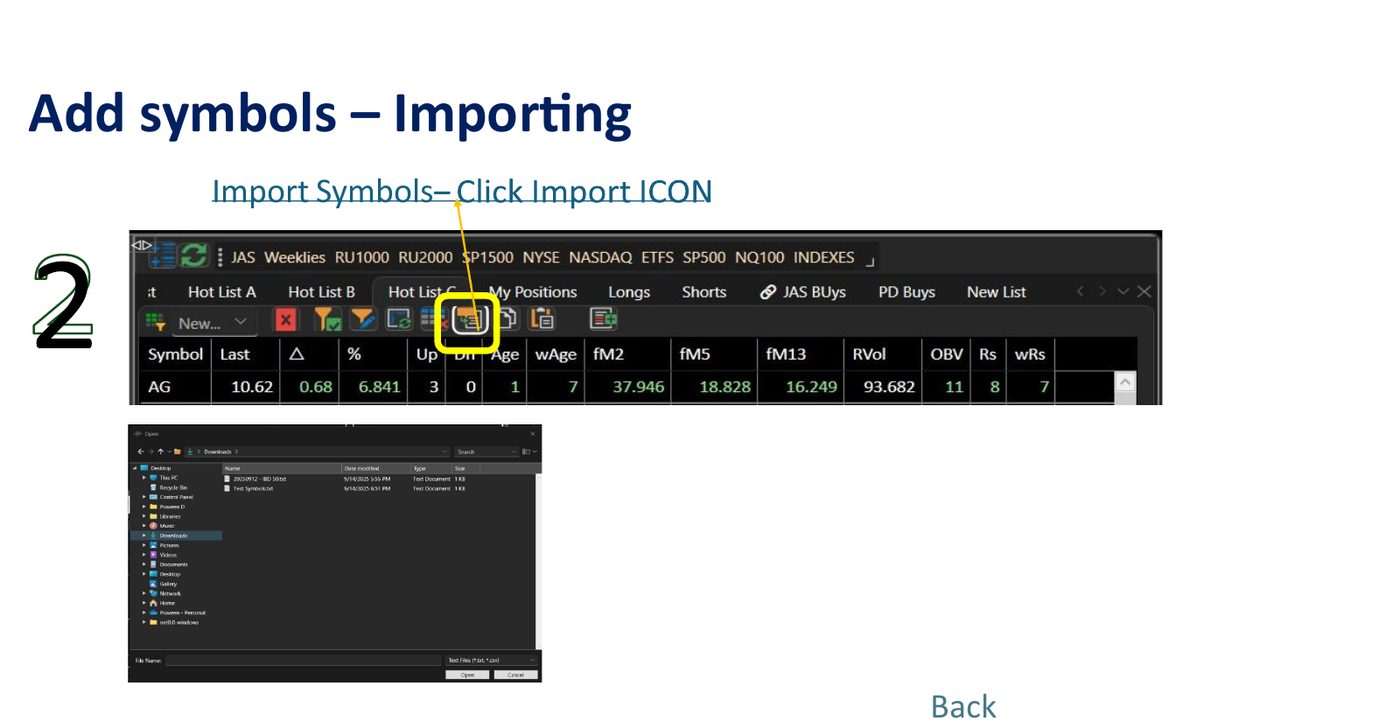
Import Symbols from File
Click the folder/import button to select a local text or CSV file for bulk list loading options.
Paste from Clipboard buffer
Click Paste to load comma or line separated symbols copied from another spreadsheet or webpage.
Delete Symbols
Select symbols and press either the Del key on your keyboard, or click the Trash button.
Transfer Across Playlist Shelves
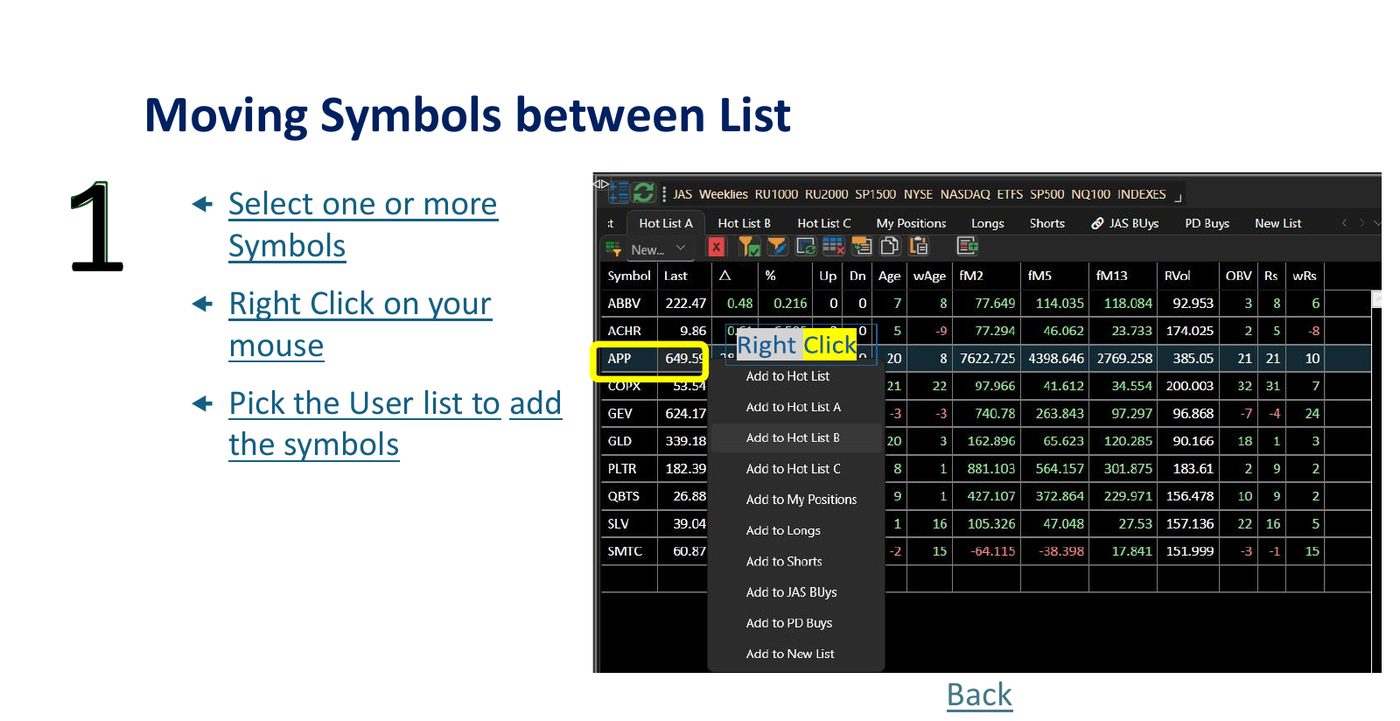
Select a sequence, right-click, then select your intended target list to shift tickers directly.
Reorganize User Lists catalog
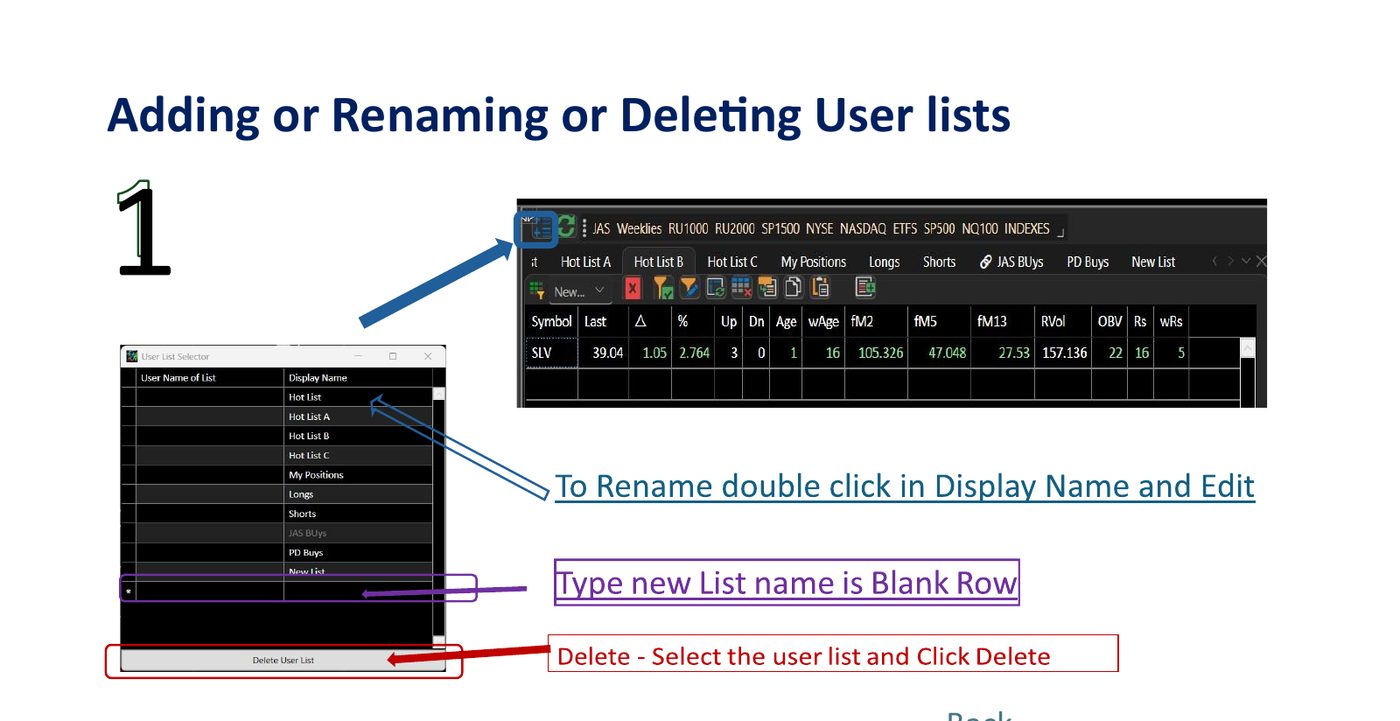
Click the gears list selector icon to open the catalog manager. Add, rename, or drop workspace groups.
Symbol Index Relations & Spread Formulas
Compose real ratio indicators using operators (e.g. AAPL/SPY) to plot relational charts.
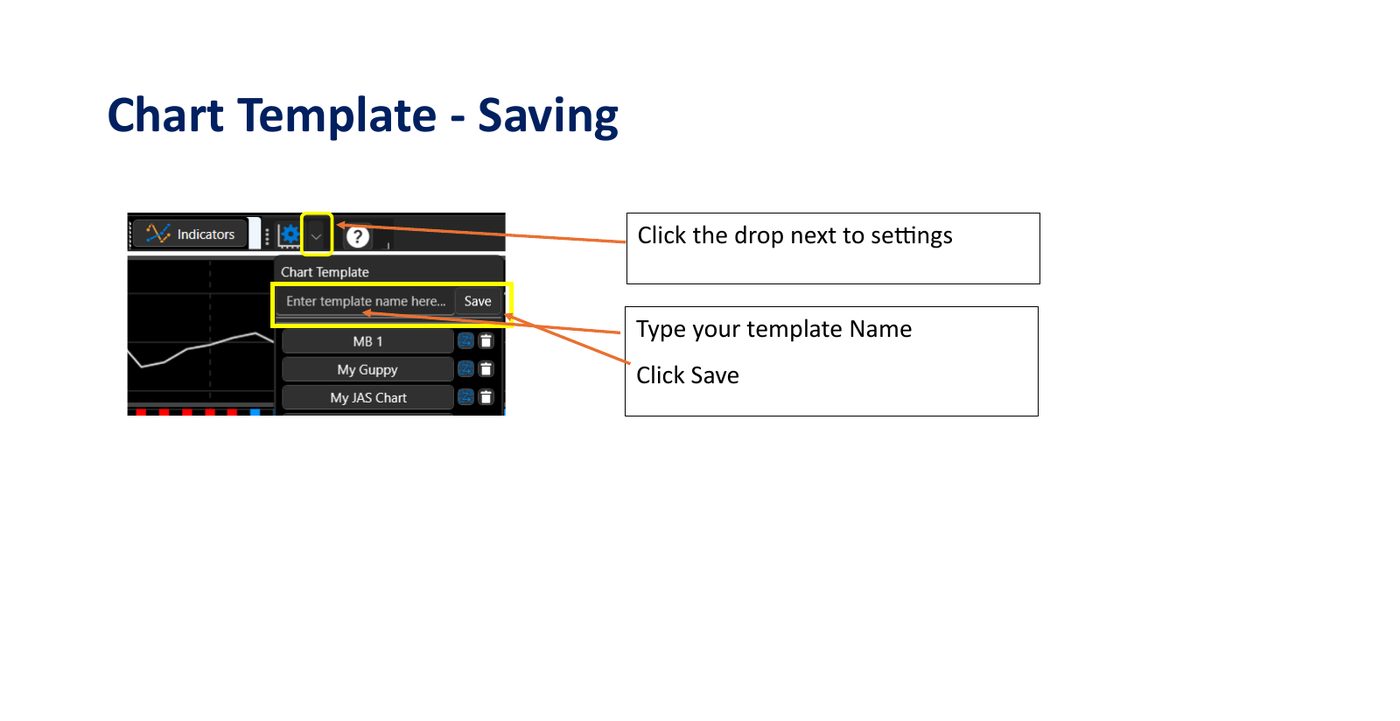
Save View Templates
Capture indicator configurations perfectly: select save template inside the settings drop list.
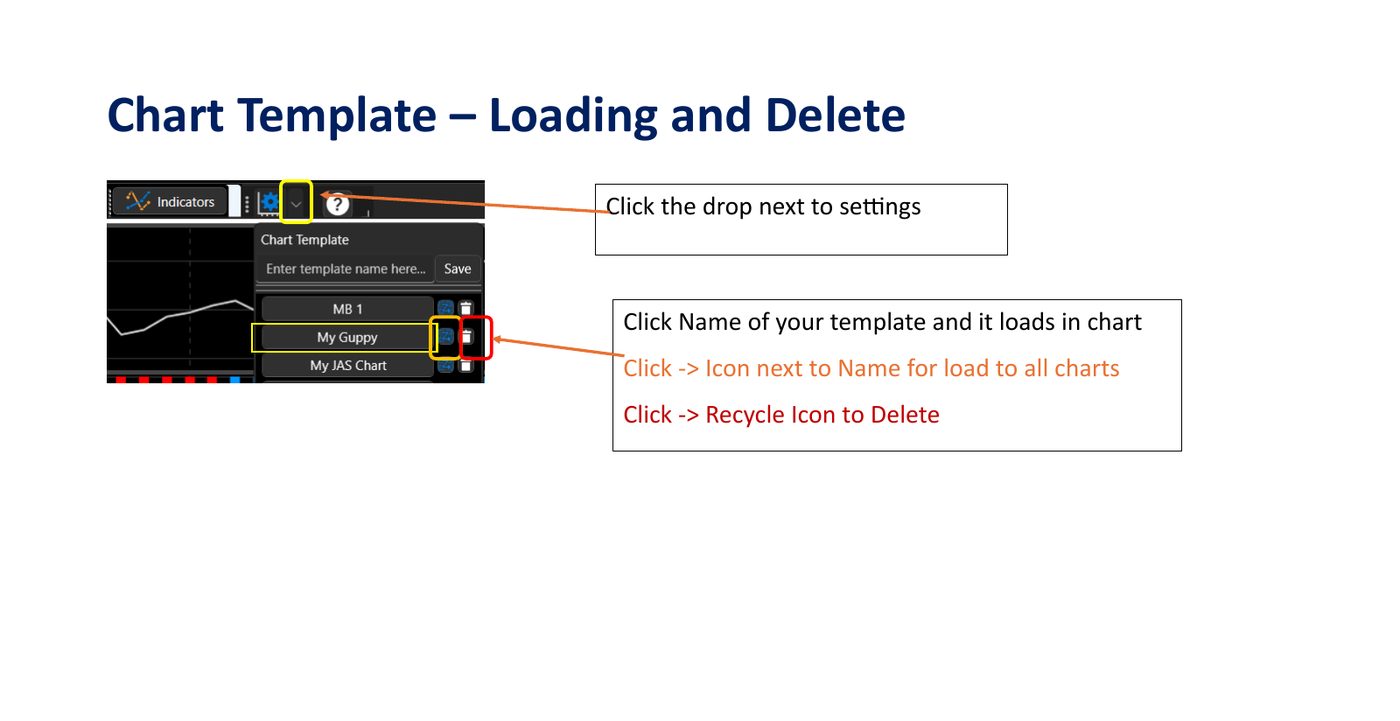
Apply or Delete Templates
Reapply layouts blockwide or target-chart specifically, or delete expired template formulas.
Keyboard Shortcuts Quick Reference:Ctrl + A Select All Tickers ·
Ctrl + Click Toggle Specific Items ·
Shift + Click Capture Sequences ·
Delete Clear Selections.
The Screener Grid displays the symbols returned by the active scanner, ranked across multiple institutional-grade factors. JP Layout exposes Last, Δ, %, Vol, ΔVol, Range, ATR, weekly/monthly OC, PMC, PMCΔ, Trend, Signal, LCC, HCD, plus weekly/monthly Trend, Pivot, Support, Resistance levels. JAS Layout shows Last, Δ, %, Up/Dn streaks, Age, wAge, fM2/fM5/fM13 momentum scores, RVol, and OBV alignment. Click any column header to re-sort.
How to Use
Click any column header to sort ascending; click again to reverse.
Click a row to load that symbol into the chart view.
Check the box on the left to mark a symbol for follow-up.
Use the filter row at the top of the grid to refine the active list.
💡 Sort Optimization
Sort by weekly + monthly trend descending (JP Layout) or fM13 descending (JAS Layout) to surface stocks with sustained multi-timeframe strength.
⚠️ Warning Markers
High RVol with negative OBV, or HCD markers, can mean distribution into strength — verify with the chart before acting.
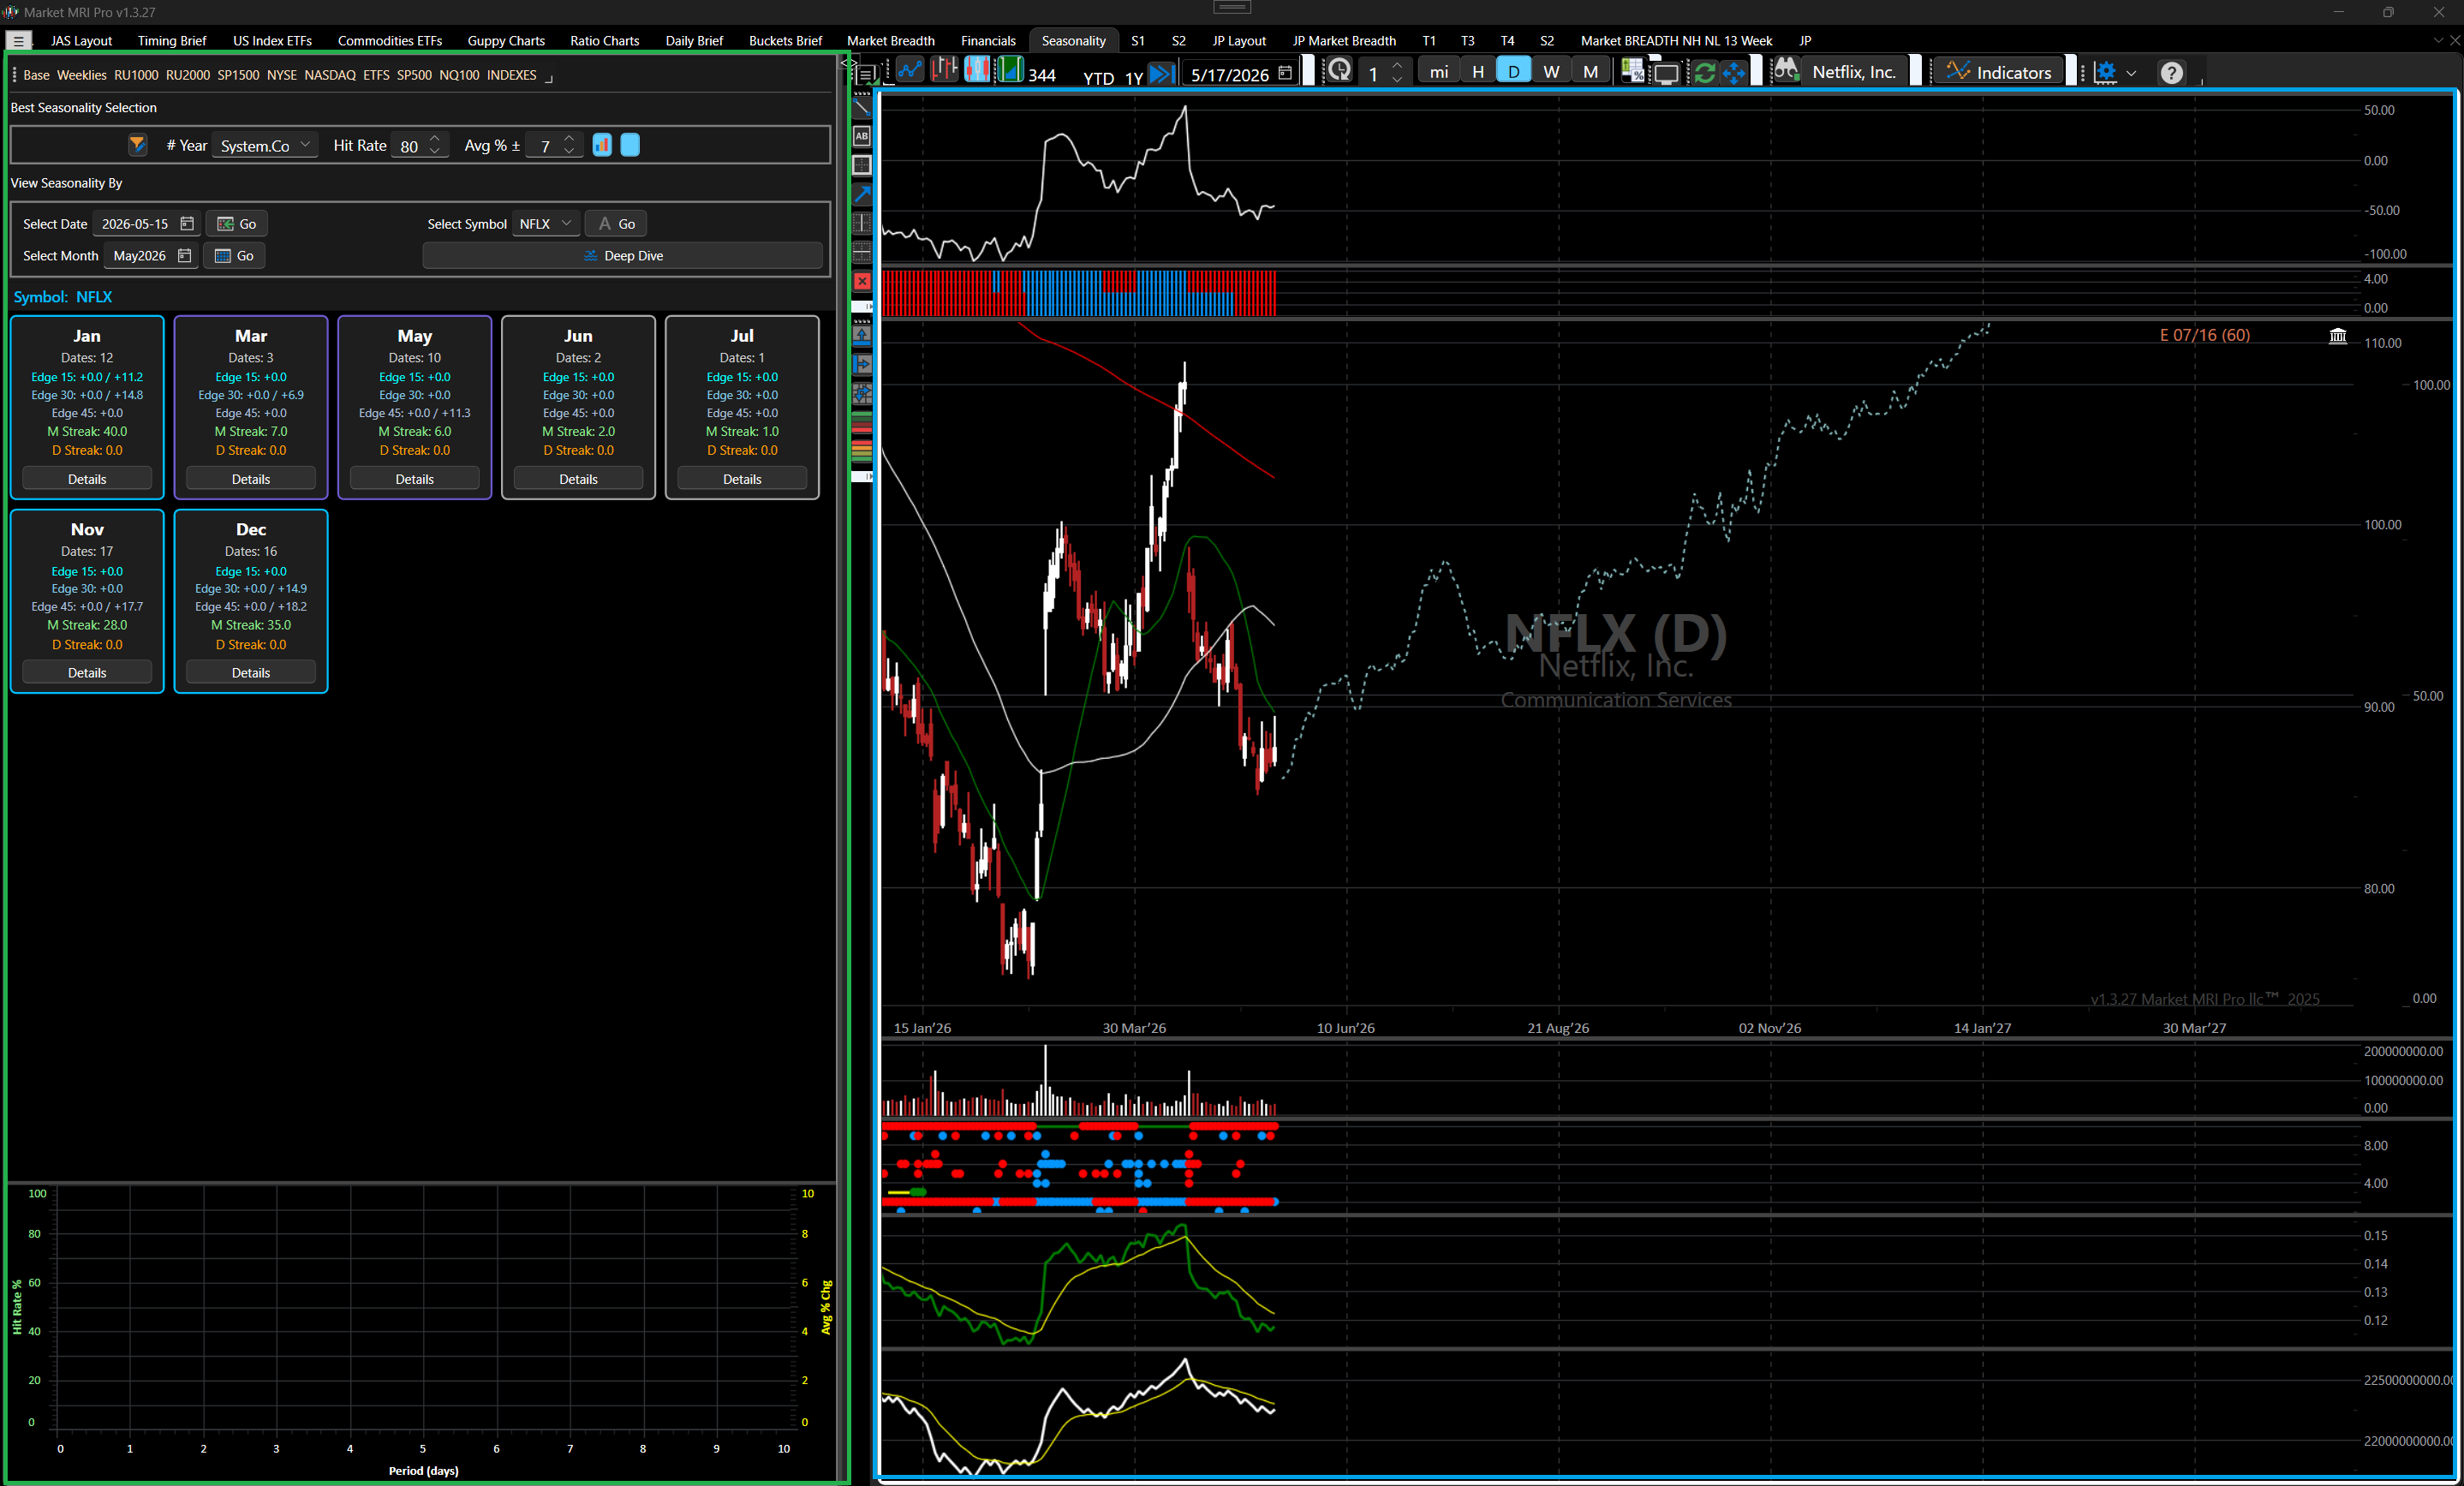
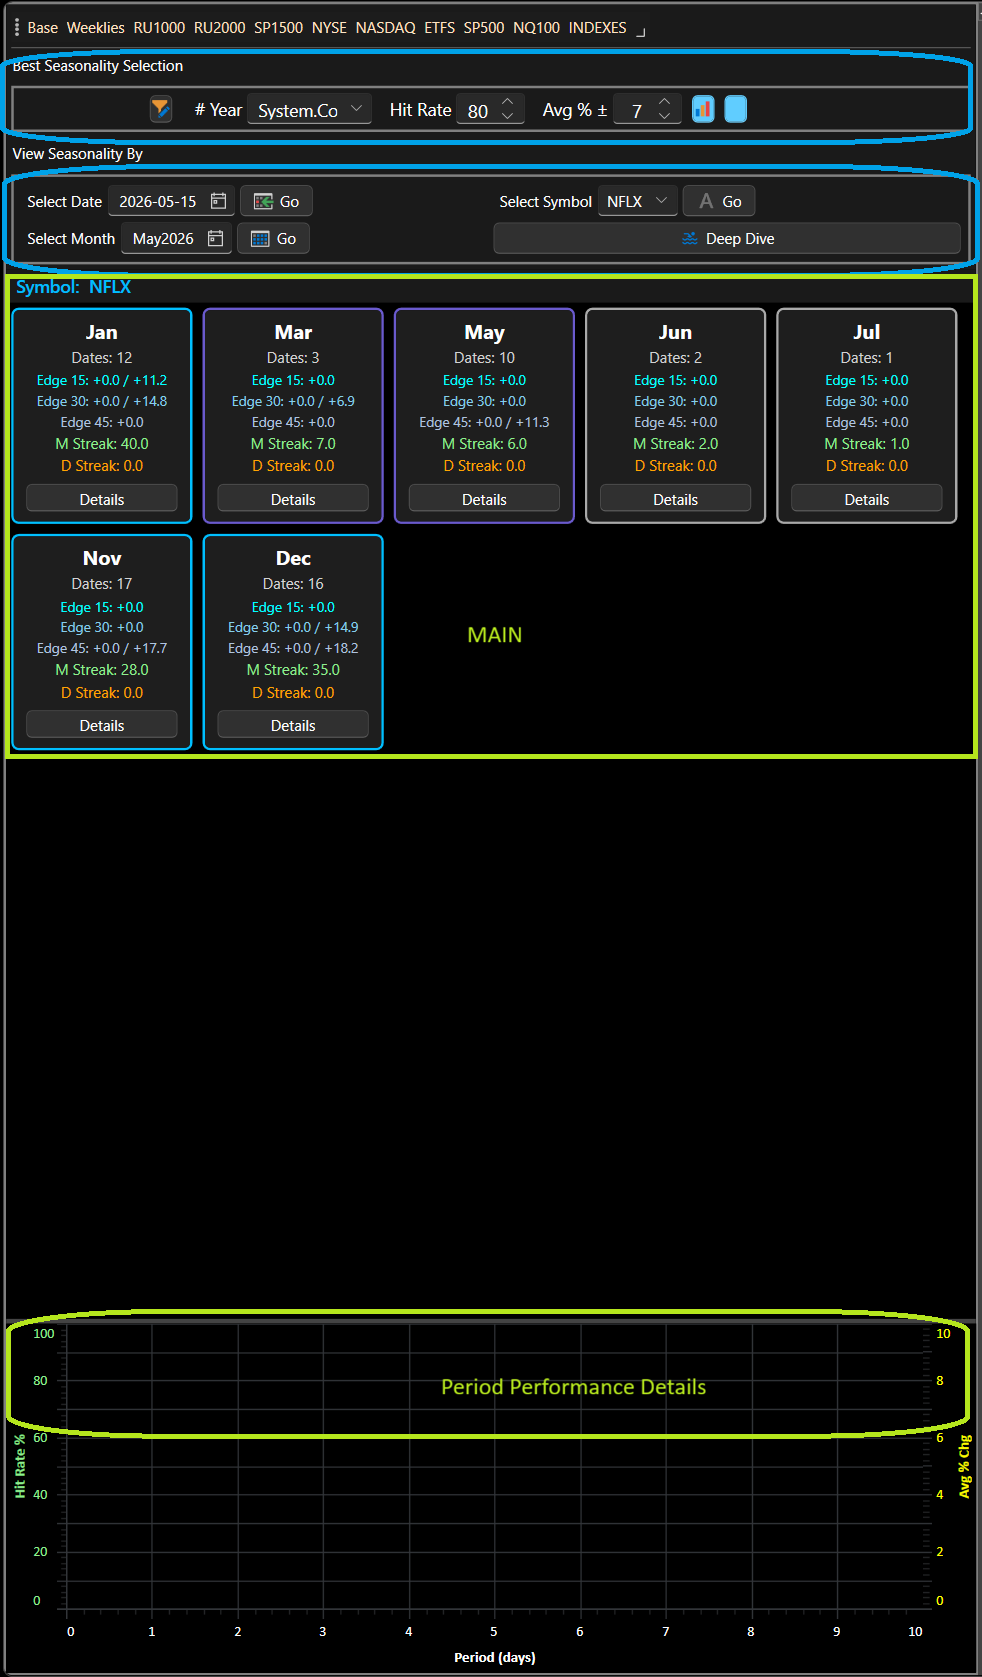
The Seasonality Grid is a specialised panel inside Market MRI Pro that lets you explore historical seasonal patterns across dates, symbols, and calendar months. It combines a screener grid, an interactive card view, and a period-detail chart so you can move quickly from a broad overview down to individual trade dates.
Key capabilities at a glance:
View by a specific Date, a Symbol, or a Month.
Card view groups results by month (Symbol query) or by symbol (Month query).
One-click drill-down shows only the dates for a selected card.
Period Performance Area / Chart toggle shows period hit rates and average % change for any selected row.
All filtering is performed client-side — no extra server round-trip for drill-down.
Figure 2: Seasonality Panel — Full View with Cards and Chart
A high-fidelity view of the unified Seasonality Panel workspace, matching comparative performance grids, calendar cards, and trend analytics in a single window representation.
CHAPTER 2
2. Layout
The Seasonality panel is divided into three vertical areas:
Area
Description
Seasonality Selection and Different Views of Data
Change Number of Year of History (years, hit rate, avg %) and View Data (Date / Symbol / Month / Deep Dive).
Main Seasonality Area- Either Card view or Grid View
Main data area. Shows the full card strip, a drill-down card + filtered rows, or the raw screener grid depending on the active View mode.
Performance Detail Area - For Selected Symbol and Date –
Show Chart or Grid to See Period from that Days it Hit Rate and Avg % Change.
Period detail for the currently selected row. Toggles between a Grid and a Chart bar+line chart.
Figure 3: Panel Layout Diagram — Selection / Main Data / Performance Detail for different Periods
The three-tier horizontal layout structure: Selection, Main comparative data area, and bottom Performance Detail section.
CHAPTER 3
3. Filter Controls
The filter bar (Row 0) is always visible and applies to every query type.
Figure 4: Selection Bar — # Year, Hit Rate, Avg % controls highlighted
Detailed view of the active query selector filter bar featuring Year constraints, Hit Rate percentage sliders, and Avg % change filters.
Control
Purpose
# Year (combo)
Limit analysis to the last 10, 20, 30, or All years of history.
Hit Rate (spinner)
Minimum hit rate threshold (0–100 %). Only patterns at or above this value are returned.
Period detail for the currently selected row. Toggles between a Grid and a Chart bar+line chart.
Toggle Button
– View Card or Grid for Symbol and Month
CHAPTER 4
4. Query Modes
Use the action buttons in the lower section of Row 0 to choose how data is fetched.
Figure 5: Query Action Buttons — Date / Symbol / Month / Deep Dive
Active action buttons in the seasonality query bar for navigating modes.
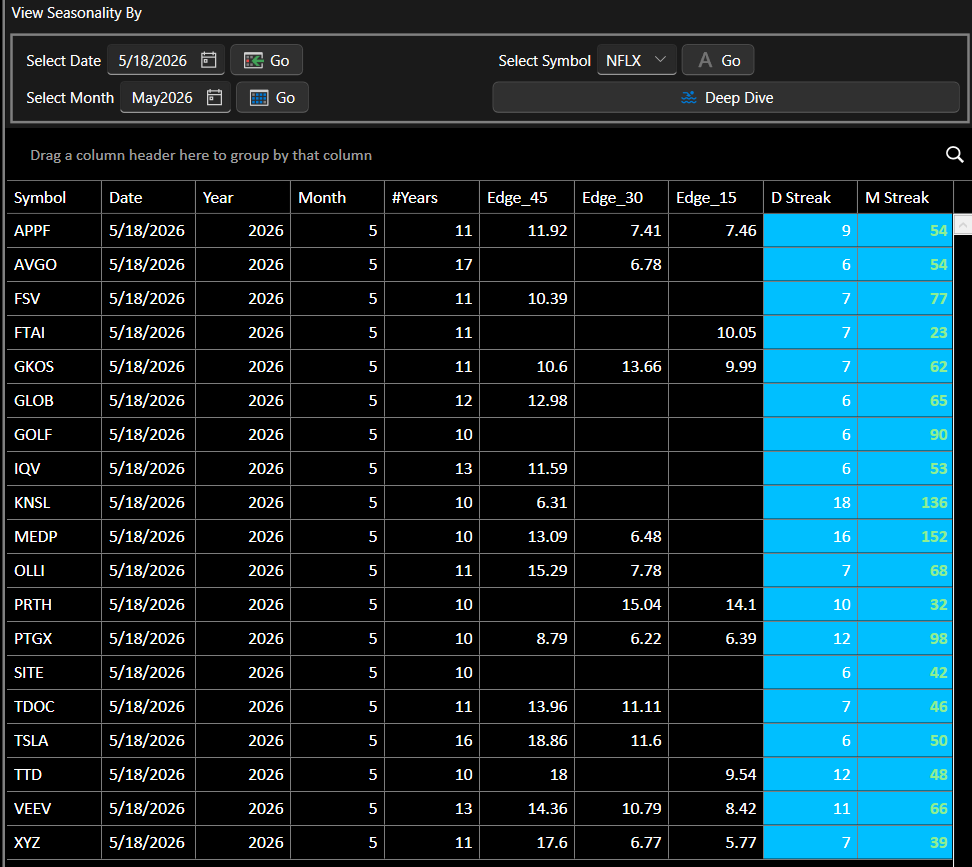
4.1 By Date
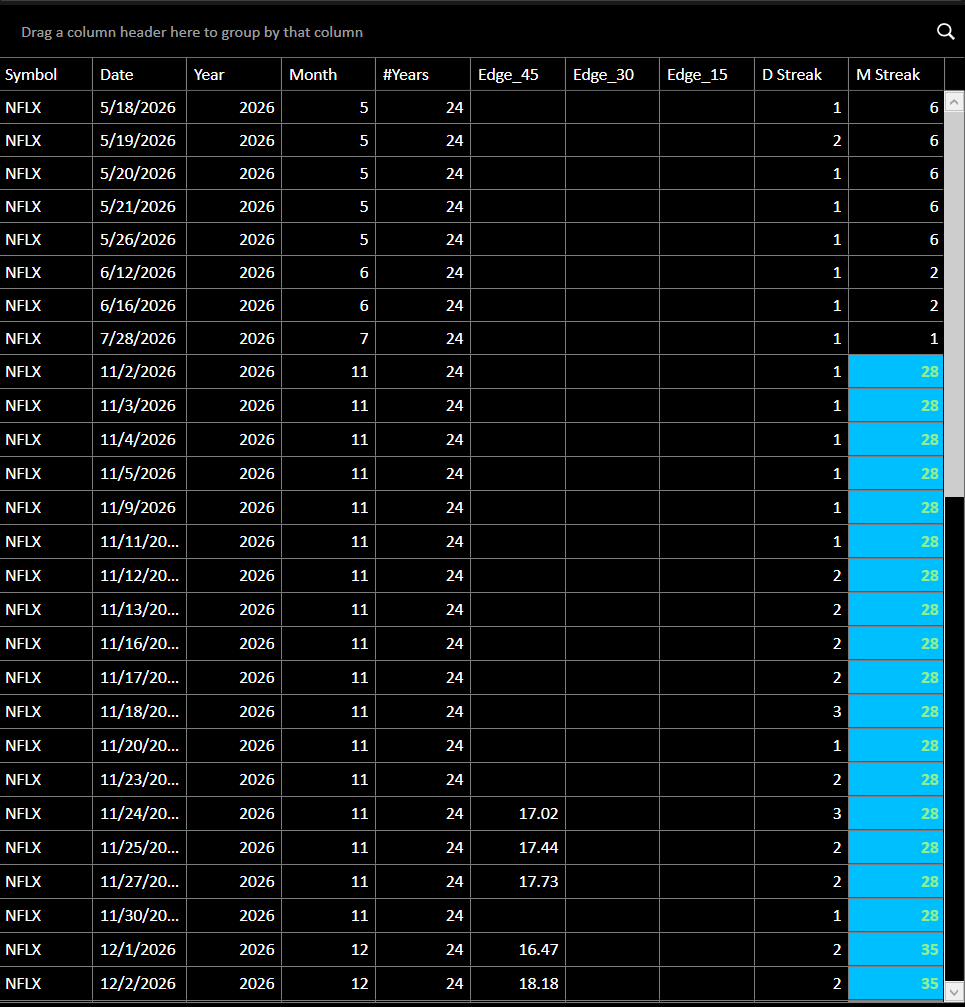
Enter a date in the date picker and press Go. The screener returns all symbols that have a qualifying seasonal pattern on or near that calendar date, sorted by the applied filters.
Result shows in Main Seasonality Area as a plain screener grid (no card view).
Select any row to populate Period Performance details area with that row's period detail.
Figure 6: By Date — Main Seasonality Area result showing symbol rows
Tabular grid presenting specific monthly trade dates matching selected seasonality parameters directly inside the selection window.
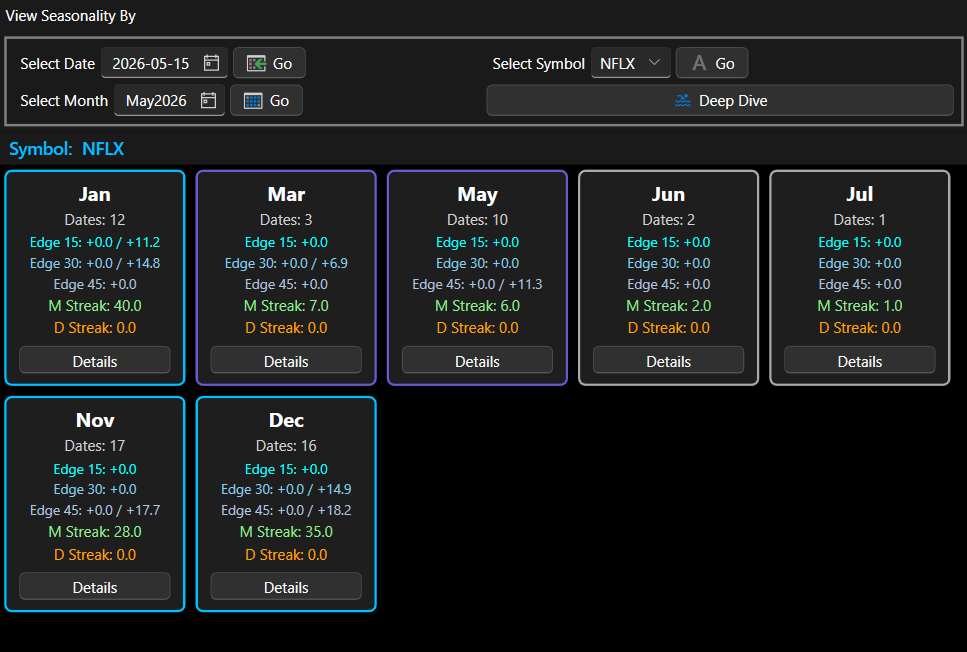
4.2 By Symbol — Card View
Select a symbol from the lookup and press Go. Results show one card per calendar month that contains qualifying dates for that symbol.
Cards are sorted January → December.
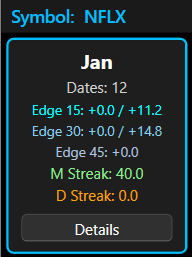
Each card displays: month name, date count, Edge 15 / 30 / 45 ranges, M Streak, D Streak.
Card border colour reflects M Streak strength (see Section 8).
Click Details to drill down into a specific month.
Figure 7: By Symbol — Month Card Strip (NFLX example)
The monthly calendar card grid mapping seasonal probabilities chronologically from January to December.
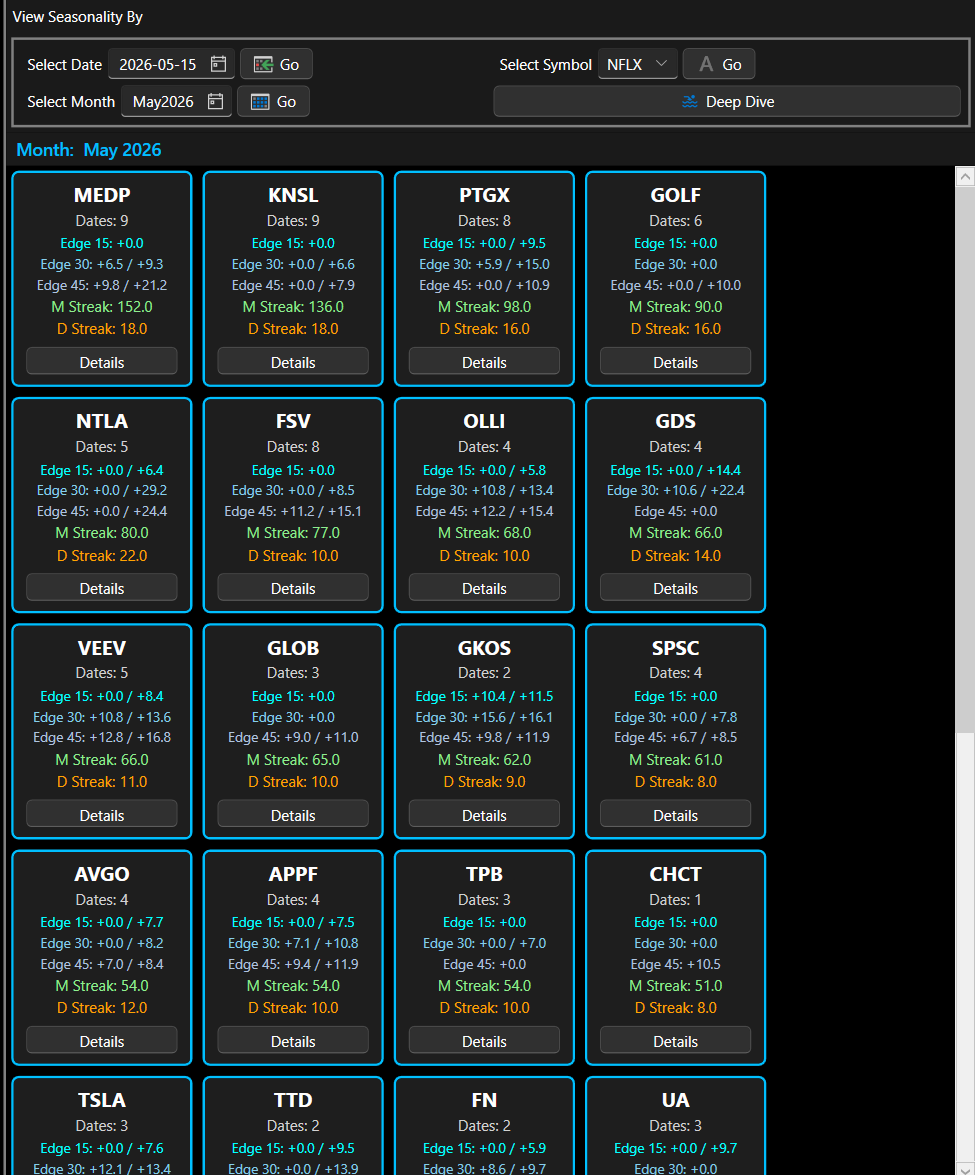
4.3 By Month — Card View
Select a month using the month picker and press Go. Results show one card per symbol that has qualifying dates in that month.
Cards are sorted by M Streak descending, then D Streak descending.
Click any card to instantly update Grid 2 with the best row for that symbol.
Click Details to drill down into the individual dates for that symbol.
Figure 8: By Month — Symbol Card Strip sorted by M Streak
Active monthly model listing multiple symbols sorted dynamically by consecutive streak counts.
CHAPTER 5
5. Card View
5.1 Card Information
Each card displays the following fields:
Title: Month name (Symbol query) or Ticker symbol (Month query).
Dates: Number of qualifying trade dates found.
E15 / E30 / E45: Edge ranges for 15-day, 30-day, and 45-day forward windows. Shown as a single value when all dates share the same edge, or min / max when they differ.
M Streak: Maximum consecutive months with a positive close-to-close return.
D Streak: Maximum consecutive day streak within the forward window.
Figure 9: Single Card — Fields Labelled
Drill-down breakdown of metric cards, highlighting active data ranges for E15, E30, and E45 edge windows.
5.2 Selecting a Card (Month query only)
In Month query mode, clicking anywhere on a card (other than the Details button) selects the best-scoring date row for that symbol and immediately updates Period Performance Area / the chart. This lets you compare chart patterns across symbols without drilling down.
NOTE
In Symbol query mode all cards represent the same symbol, so clicking a card does not change the chart. Use Details to explore a specific month's dates instead.
5.3 Details Drill-Down
Click the Details button on any card to enter drill-down mode. The panel transitions to a split view:
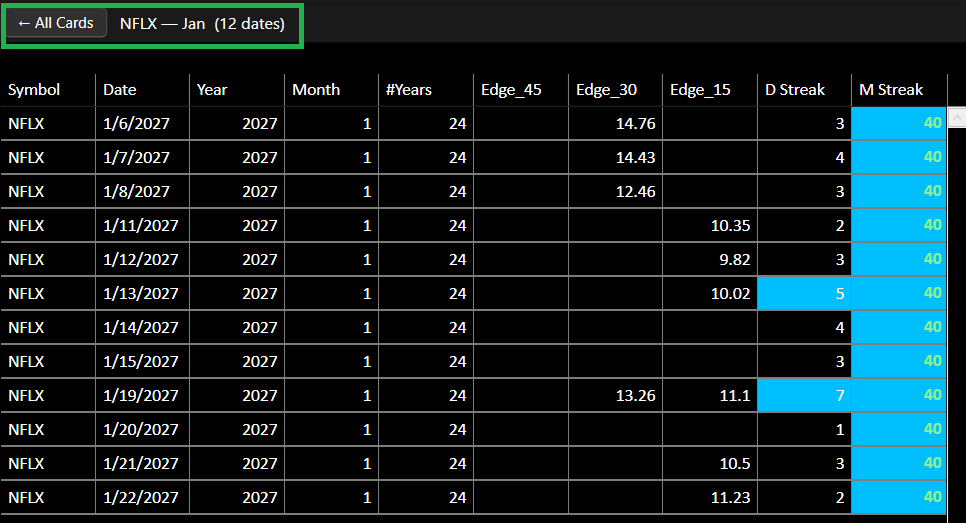
Top — Breadcrumb bar: ← All Cards button + drill-down title (e.g. NFLX — Jan (12 dates)).
Middle — The focused card: Same information, no Details button.
Bottom — A grid: Containing only the date rows for that card, with the same columns and colour coding as Main Seasonality Area grid.
Selecting any row in the drill-down grid updates Period Performance Area exactly as selecting a row in Main Grid would.
Figure 10: Drill-Down View — Breadcrumb, Single Card, and Filtered Date Grid
Breadcrumbs navigation view triggered upon detailed inspection of specialized monthly model slices.
5.4 Back to All Cards
Click ← All Cards in the breadcrumb bar to exit drill-down mode and return to the full card strip. Period Performance Area retains whatever row was last selected.
NOTE
A new query (pressing any Go button) also resets drill-down mode automatically.
CHAPTER 6
6. Drill-Down Grid
The drill-down grid displays the raw date rows for the selected card, filtered entirely on the client — no server request is made. It shares the same column set and colour-coding rules as the main Grid screener.
Click any row to update Period Performance Area and the chart for that specific date.
Columns are auto-generated from the server payload; and per-period Hit Rate / Avg % columns are hidden (those appear in Period Performance Area instead).
Figure 11: Drill-Down Grid — Date Rows with Colour Coding
Grid 2 (Row 3) updates automatically whenever a row is selected in Main Seasonality Area or the drill-down grid. Use the toggle button in the filter bar to switch between pivot table and chart.
7.1 Pivot Table Mode
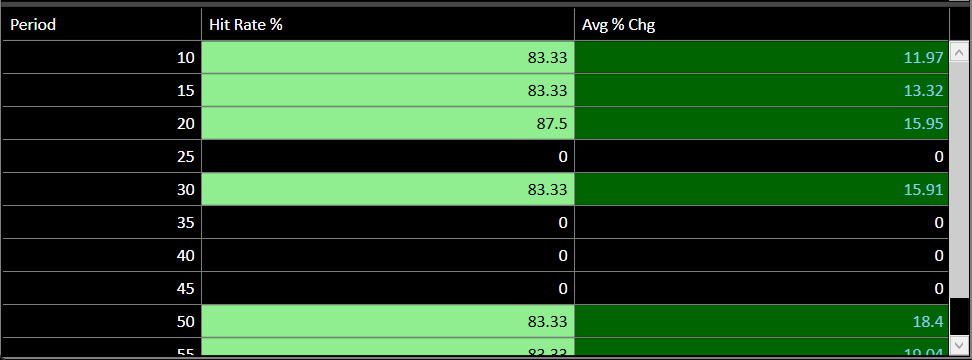
Shows one row per forward period (10 d, 15 d … 60 d) with Hit Rate % and Avg % Change. Cells are colour-coded: green shades for high hit rates, red shades for low.
Figure 12: Period Performance — Pivot Table Mode (Period / Hit Rate % / Avg % Chg)
Forward-looking pivot tables representing cumulative historical average performance indicators.
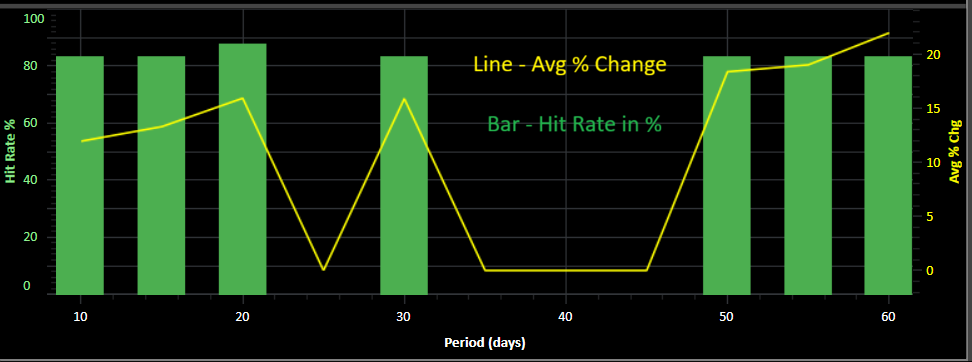
7.2 Chart Mode (default)
A SciChart bar+line combo chart with dual Y-axes:
Green bars (left axis, 0–100 %): Hit Rate % per period.
Yellow line (right axis, auto-range): Avg % Change per period.
X-axis: Forward period in days (10 → 60), ascending left to right.
Double-click the chart to zoom to full extent. Hover for a rollover tooltip.
Trend line graph plotting dynamic probability and hit ratios for forward windows (10-60 days).
🎨
Historical Heatmap Color Code Reference
The seasonality database highlights trends using intuitive heatmaps. Apply consistent strategies when reviewing data.
Card Borders (M-Streak)
≥ 15 Yrs: Deep Sky Blue Card highlight
10–14 Yrs: Soft Green/Teal accent border
5–9 Yrs: Neutral Slate border
< 5 Yrs: Inactive gray scale border
Hit-Rate Probability
100% Rate: Glowing Neon Green badge
90–99% Rate: Standard light green indicator
79–89% Rate: Mild emerald background
11–20% Rate: Soft warning orange marker
1–10% Rate: Low win potential rose flag
Average Delta Shift
≥ +10% Peak: Intense Green highlight bounds
+5% to +9.9%: Mid momentum green values
−5% to −9.9%: Short biased rose indicators
≤ −10% Drop: Deep warning Red bounds
CHAPTER 9
9. Tips & Shortcuts
💡 Platform Best Practices
Fast symbol comparison (Month query): Click cards in the strip one after another — each click updates Period Performance Area instantly without leaving the card view.
Narrow down a month (Symbol query): Click Details on a month card to see exactly which historical dates triggered that pattern, then click a date row to see its full period analysis in Period Performance Area.
Toggle Period Performance Area view: Use the bar-chart icon toggle button in the filter bar to switch between the grid table and the chart. The selection persists until you toggle again.
🖱️ Additional Operations Advice
Filter within Main Seasonality Grid: Enable the Filter Row toggle to add column-level text/numeric filters without re-querying the server.
Mouse-wheel on spinners: All spinner controls (Hit Rate, Avg %) support mouse-wheel increment/decrement for fine adjustments.
Returning from drill-down: Always use ← All Cards rather than re-running the query — the full card strip is already in memory and restores instantly.
Media Assets Manager
v1.1.3
Drag, drop, or select screenshot image or video files to instantly upload them to your local ug_images/ or videos/ folders so they resolve flawlessly on live pages.
Uploading media asset...
Drag & drop images or videos hereAccepts PNG, JPG, WebP, GIF, MP4, WebM, MOV · Up to 100MB
Developer copy snippet
Copy this reference template syntax directly into your pages to target newly loaded media resources: